What is a Comparison Report?
A Comparison Report allows you to compare the scores/results of one group of subjects conducted by two different 'coaches'. For example, an organisation uses a Quality Assessment (QA) form to assess team member's capability. A QA team member completes an Assessment on a team member and their team leader completes the same form on the same team member. The comparison report allows you to compare those results.
The Comparison Report is a great way to calibrate the assessments of two coaches.
The comparison report also allows you to compare the results of two different subjects against each other, for example the QA scores of 'Team A' vs 'Team B'
How to Run a Comparison Report
- Click on 'Reports' from the main menu.
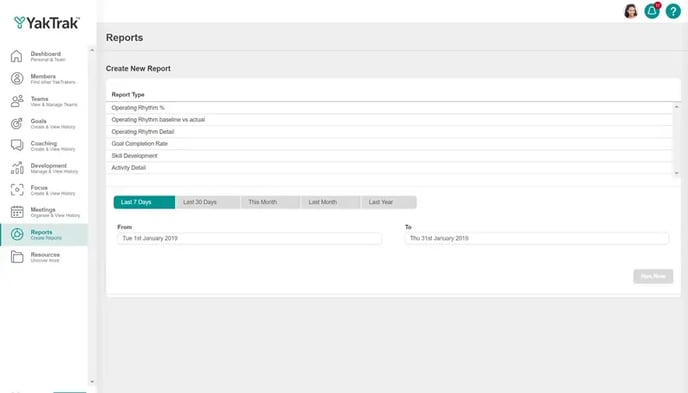
- You will be presented with a series of options for reporting.

- Group A: Who is the first group, role, individual you want to compare?
- Teams': Report on individual teams in your line of sight.
- 'Teams & Children: Report on any teams reporting into you and their teams.
- 'Team Level': Report on all leaders reporting into you not including yourself.
- 'Roles': Report on all team members of a particular role.
- 'Individuals': Report on individuals that report into you.
- Group B: Who is the second group of subjects you want to compare against?
- Routines: Select which document you want in the report (Note: Each Routine has unique fields which means only one Routine can be selected at a time and only forms with scores will appear as options)
- Subjects: Select who's data you want the report to display.
- Date Range: Select the date range you would like to run the report for.
- Group Data by: Allows you to chunk the data into larger groups
- Click on 'Run Now', to view in on YakTrak. 'Export to XLSX' to view in Excel or 'Email Report' to have the document emailed to you.
How to interpret the Comparison Report

- The overall score section provides a line graph that shows the average over the selected period for both groups
- The bar graph breaks the average down further and provides visibility of the average score for each "section" of the selected routine and compares group A to Group B

- Underneath the 'Overall' data, each 'Section' of the form is broken down so you are able to compare the overall score for each question between Group A and Group B

- The result are also provided in a table (see above) which can be exported to XLSX
- This report includes information including:
- How many sessions were recorded for each subject
- The average score
- The highest score
- A breakdown of every section and question of the form for each subject